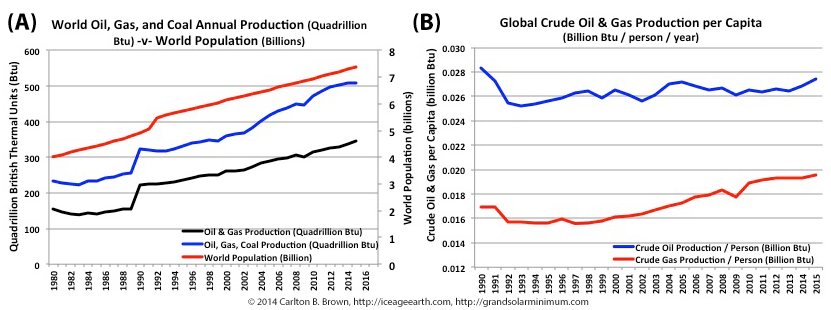
Figure A) World population growth has tracked energy production growth. The 3, 5, 10, and 20-year compound annual growth rates for oil and gas production have outpaced population growth rates, implying a growth in per capita consumption of energy resources. B) Humans are using more energy and especially more natural gas per capita, and this is a multi-decade trend. Conclusion: Economic growth leads to increased per capita consumption of fossil fuels, which more rapidly depletes the world’s non-renewable energy reserves.[i]
Population and Economic Growth Accelerate Energy Reserve Depletion
Between 1950 and 2017 the world’s population grew by 5 billion people, and every year the population continues to grow by 85 million people.[ii],[iii] This population growth is unrelenting, with 20-year and 3-year compound annual growth rates (i.e., year after year) broadly the same at 1.2 percent and 1.1 percent, respectively. Since 1980 most of this growth has occurred in Asia and Africa.[iv]
Economic growth and development has helped improve access to energy, food, and clean water, and thereby has played a major role in sustaining world population growth.[v],[vi] Population and economic growth have come at a price: the depletion of finite global resources and increased environmental destruction with little regard for the needs of future generations.
Under business as usual, it is expected there will be 9-plus billion people living in the world by 2050. Most of the population growth from current levels is expected to be in Asia and Africa,[vii],[viii],[ix],[x] which depend heavily on fossil fuel imports to achieve economic growth.
Population growth has tracked the growth in fossil fuel production since the early 1990s (see Figure A), and humans have been steadily increasing their energy consumption per capita during this period, especially for gas, thus accelerating the depletion of energy reserves. Population growth therefore accelerates energy demand and more rapidly depletes energy reserves.
[i] Data: (1) Figure 8.3.A: U.S. Energy Information Administration, International Data. World population statistics. https://bit.ly/2LF7Gom. (2) Figure 8.3.B: Oil, gas, and coal data was obtained from the Energy Information Administration from their International Energy Statistics data portal. This graphic utilizes the following data files. Natural gas https://bit.ly/2LC6GBo, Crude Oil https://bit.ly/2IWeEaP, Coal data https://bit.ly/2L6pk3w. Standard fuel units of energy (barrels, cubic feet, and short tons) were converted to British thermal units (Btu) using conversion factors obtained from, https://www.eia.gov/energyexplained/index.php?page=about_btu.
[ii] J. Cleland, “World Population Growth; Past, Present and Future.” Environ Resource Econ (2013) 55: 543. https://doi.org/10.1007/s10640-013-9675-6.
[iii] U.S. Energy Information Administration, International Data. World population statistics. https://bit.ly/2LF7Gom.
[iv] U.S. Energy Information Administration, International Data. World population statistics. https://bit.ly/2LF7Gom.
[v] Global Europe 2050. Directorate-General for Research and Innovation. 2012. Socio-economic Sciences and Humanities. EUR 25252.
[vi] J. Cleland, “World Population Growth; Past, Present and Future.” Environ Resource Econ (2013) 55: 543. https://doi.org/10.1007/s10640-013-9675-6.
[vii] Global Europe 2050. Directorate-General for Research and Innovation. 2012. Socio-economic Sciences and Humanities. EUR 25252.
[viii] Conduct a Google search, “United Nations, World population, 2050, 2100.”
[ix] J. Cleland, “World Population Growth; Past, Present and Future.” Environ Resource Econ (2013) 55: 543. https://doi.org/10.1007/s10640-013-9675-6.
[x] P. Gerland et al., “World Population Stabilization Unlikely This Century.” Science (New York, NY). 2014;346(6206):234-237. doi:10.1126/science.1257469.

