Renewable energy switch is too slow to mitigate climate change risks

Renewable energy switch is too slow to mitigate climate change risks

Pivotal to ensuring that a renewable energy switch moves ahead rapidly is the need to send the right messages about climate change, and provide the economic incentives that will motivate business and society as a whole to make changes. These messages must also convey the reality of our finite and dwindling energy and water reserves, and the damage we are doing (greenhouse gases, pollution) by using these resources. By refocusing the climate and resource messages governments can then engender the right sense of urgency and motivation for people and businesses to act and help switch the energy system to renewables.

Higher oil prices achieved through the perception of energy scarcity and the unveiling of catastrophic risks will be a more powerful motivator for businesses, transportation, and industry generally (i.e., the largest energy users) to rapidly switch the energy system than the perceived need to mitigate anthropogenic global warming.


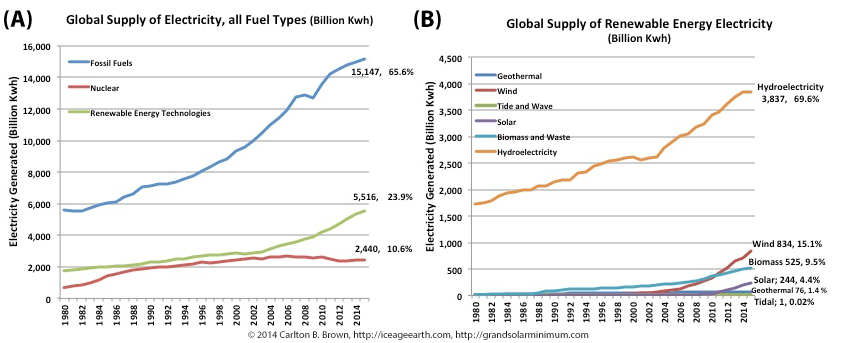
Figure A) In 2015 fossil fuels and nuclear energy supplied more than three-quarters of electricity generated. Between 1980 and 2015, these non-renewable energy sources supplied most of the growth in electricity generation (75 percent). In the last decade, non-hydroelectric generation by renewables has grown to account for 7.2 percent of global electricity generation, with hydroelectricity accounting for 16.6 percent. Electricity generation with renewables has shown a 10-year compounded annual growth rate of 5.3 percent, and non-hydroelectric renewables 16 percent. B) Wind, biomass, and solar sources of renewable energy are beginning to make an impact in the market.[iv]

Earth entered the ice age millennia ago

Earth entered the ice age millennia ago

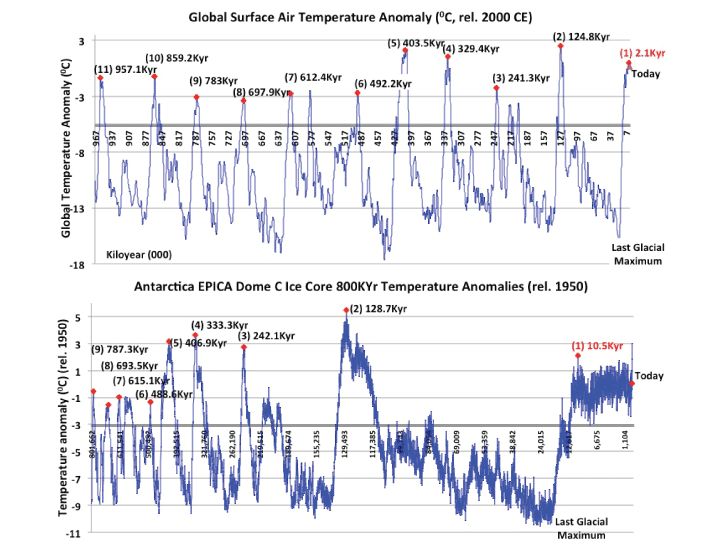
Nine of Antarctica EPICA Dome C’s glacial cycle temperature peaks (climate optima) were compared with their corresponding global climate optima over the last 800,000 years. Red dots and numbered dates are used to highlight the corresponding Antarctic and global climate optima. In all but two glacial cycles the climate optimum was reached in Antarctica first, on average 2,100 years before it was reached globally. The Holocene Climate Optimum was reached 10,500 years ago in Antarctica (Dome-C data) and 2,100 years ago globally, yielding a “phasing gap” of 8,400 years. This 8,400-year phasing gap is the longest in 800,000 years of glacial cycles (Antarctica versus Global). Likewise, the interval between the Holocene Climate Optimum and its preceding climate optimum was the longest recorded interval in 800,000 years in Antarctic and 2 million years globally.[1],[2]

Based on the above graphics, and the Antarctic-global climate optima phasing gaps and inter-climate optimum intervals, there is no justification for proposing the ice age lies ahead of us. However, this did not stop the Intergovernmental Panel on Climate Change (IPCC) from delaying the next ice age by 30,000 years, in its advice to our governments. The IPCC told our governments that this theoretical delay represented a supposedly “robust finding,” despite not subjecting their new theory to peer review. [3]

Delaying an ice age by 30,000 years cannot be statistically justified on at least three counts. By delaying the ice age 30,000 years a statistical outlier (P-value <0.05) is created for interglacial durations, inter-climate optima intervals, and Antarctic-to-global climate optima phasing gaps, and the data is changed from having a normal distribution to a non-normal distribution. If normal science were operating in an “unimpinged manner” in the climate science field, it would emphatically reject the IPCC’s perilously dangerous 30,000-year delay to the start of the next ice age.

Click on this page and download a free copy of my book “Revolution: Ice Age Re-Entry,” and read more about this topic in Chapters 2 and 3.

[1]      Bintanja, R. and R.S.W. van de Wal, “North American ice-sheet dynamics and the onset of 100,000-year glacial cycles.” Nature, Volume 454, 869-872, 14 August 2008. doi:10.1038/nature07158. National Centers for Environmental Information, NESDIS, NOAA, U.S. Department of Commerce. Global 3Ma Temperature, Sea Level, and Ice Volume Reconstructions. https://www.ncdc.noaa.gov/paleo-search/study/11933. Downloaded 10/27/2015.

[2]      J. V. Jouzel et al., 2007, “Orbital and Millennial Antarctic Climate Variability over the Past 800,000 Years.” Science, Volume 317, No. 5839, 793-797, 10 August 2007. National Centers for Environmental Information, NESDIS, NOAA, U.S. Department of Commerce. EPICA Dome C – 800KYr Deuterium Data and Temperature Estimates. https://www.ncdc.noaa.gov/paleo/study/6080. Download data: Downloaded 08/02/2016.

[3]      IPCC, Climate Change 2007: The Physical Science Basis. Contribution of Working Group I to the Fourth Assessment Report of the Intergovernmental Panel on Climate Change [Solomon, S., D. Qin, M. Manning, Z. Chen, M. Marquis, K.B. Averyt, M. Tignor and H.L. Miller (eds.)]. Cambridge University Press, Cambridge, United Kingdom and New York, NY, USA, 996 pages [Exposé: See page 56, Box TS.6. This section details the influence of earth’s orbit of the sun on the onset of an ice age. We are told how the Milankovitch theory, associated with controlling ice ages, is a well-developed theory (Whereas it is contentious). The IPCC tells us that global warming won’t be mitigated by changes in earth’s orbit (i.e., which decreases solar irradiance at the upper atmosphere), and that earth will not enter the next ice age for 30,000 years. More worrying, on page 85, section TS.6.2.4, it is re-emphasized that earth will not enter another ice age for 30,000 years or more, and that this was a “robust finding.”

The last ice age did not end 11,700 years ago, that was the Younger Dryas

The last ice age did not end 11,700 years ago, that was the Younger Dryas

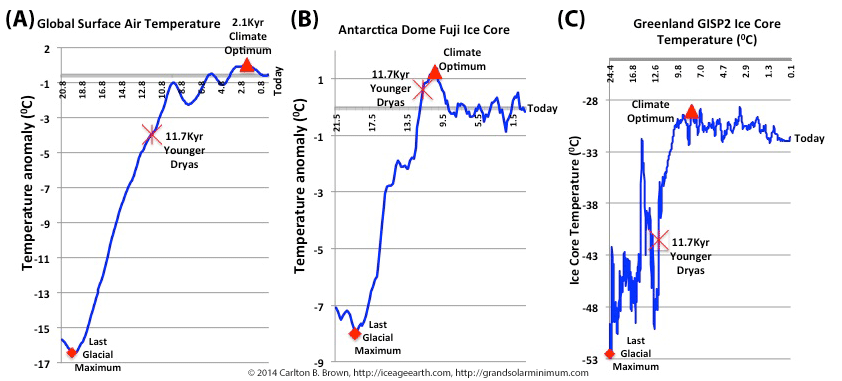
Reconstructed global,[i] Antarctic,[ii] and Arctic[iii] glacial cycle temperatures from the last glacial maximum or end of the last ice age (lowest temperature, red diamond shape) to just past the climate optimum at the end of the interglacial period (highest temperature) delineate three points of reference i.e., the last glacial maximum, the end of the Younger Dryas 11,700 years ago, and the Holocene Climate Optimum (red triangle shape). The glacial maxima and the climate optima are at either end of the interglacial period. The supposed end of the last ice age 11,700 years ago (11.7 kiloyear) is marked above. If the ice age ended 11,700 years ago then the 11.7 kiloyear marker should be close to the glacial maximum marker at the bottom of the graphics, but this is not the case.

This data clearly demonstrates that the last ice age ended at the glacial maximum, between 19,300 (Antarctica) and 24,000 years ago (Arctic). The Younger Dryas ended 11,700 years ago. In the intervening 8,000–12,000 years between the glacial maximum and the end of the Younger Dryas, when the current Holocene interglacial had “officially” started (as we are told), nearly two-thirds of the Holocene’s total sea level rise, and three-quarters of the Holocene’s total temperature rise had already taken place. Therefore, equating the end of the Younger Dryas with the end of the last ice age means we are in error as to the correct stage of the glacial cycle that we are in now.

In reality, the Younger Dryas represented the worst rapid climate change event since the last glacial maximum. Prior to the end of the Younger Dryas 11,700 years ago, and within the space of a few decades, the temperature in the Arctic dropped by about nine degrees Celsius.[iv] The temperature did not recover for another three hundred years. During this time the Arctic ice sheets advanced and the most pronounced fauna extinctions of the Holocene interglacial took place, including dozens of mammalian and avian species.[v],[vi]

Click on this page and download a free copy of my book “Revolution: Ice Age Re-Entry,” and read more about this topic in Chapter 3.

[i]       R. Bintanja and R.S.W. van de Wal, “North American ice-sheet dynamics and the onset of 100,000-year glacial cycles.” Nature, Volume 454, 869-872, 14 August 2008. doi:10.1038/nature07158. National Centers for Environmental Information, NESDIS, NOAA, U.S. Department of Commerce. Global 3Ma Temperature, Sea Level, and Ice Volume Reconstructions. https://www.ncdc.noaa.gov/paleo-search/study/11933. Downloaded 10/27/2015.

[ii]      R.V. Uemura et al., 2012, “Ranges of moisture-source temperature estimated from Antarctic ice cores stable isotope records over glacial-interglacial cycles.” Climate of the Past, 8, 1109-1125. doi: 10.5194/cp-8-1109-2012. National Centers for Environmental Information, NESDIS, NOAA, U.S. Department of Commerce. Dome Fuji 360KYr Stable Isotope Data and Temperature Reconstruction. https://www.ncdc.noaa.gov/paleo-search/study/13121. Downloaded 05/05/2018.

[iii]     R.B. Alley., 2004, “GISP2 Ice Core Temperature and Accumulation Data.” National Centers for Environmental Information, NESDIS, NOAA, U.S. Department of Commerce. https://www.ncdc.noaa.gov/paleo/study/2475. Downloaded 05/05/2018.

[iv]     A.E. Carlson, 2013, “The Younger Dryas Climate Event.” In: Elias S.A. (ed.) The Encyclopedia of Quaternary Science, Volume 3, 126-134. Amsterdam: Elsevier. http://people.oregonstate.edu/~carlsand/carlson_encyclopedia_Quat_2013_YD.pdf.

[v]      Anthony D. Barnosky et al., “Approaching a state shift in Earth’s biosphere.” Nature Volume 486, 52–58 (07 June 2012). doi:10.1038/nature11018.                    .

[vi]     R. B. Firestone et al., “Evidence for an extraterrestrial impact 12,900 years ago that contributed to the megafaunal extinctions and the Younger Dryas cooling.” PNAS October 9, 2007. 104 (41) 16016-16021; https://doi.org/10.1073/pnas.0706977104.

Greenland’s ice core confirms the Arctic entered its ice age 8,000 years ago

Greenland’s ice core confirms the Arctic entered its ice age 8,000 years ago

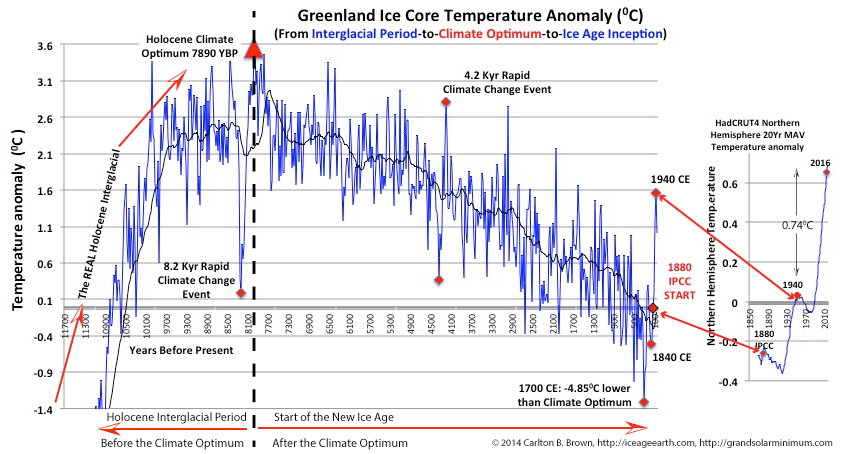
A graphic of Greenland’s ice core climate reconstruction from 9080 BCE (after the Younger Dryas) to 1960 CE is positioned alongside a 20-year moving average of the Northern Hemisphere temperature anomaly (1870 to 2018; right hand diagram).[i] This depicts how the modern instrument era-derived Northern Hemisphere temperature data relates to Greenland’s ice core temperature data. This juxtaposition of different climate data was done to give an approximate bearing on today’s climate relative to the climate optimum.

Greenland’s ice temperature actually declined by 4.860C between the Holocene Climate Optimum in 5980 BCE (peak temperature) and 1700 CE, and then rose by 2.870C between 1700 CE and 1940 CE. The 2016 temperature peak is still 1.90C lower than at Greenland’s Holocene Climate Optimum 8,000 years ago.

By comparing today’s temperature only with that in 1880 we are being led to believe that a 1.020C rise in temperature since 1880 is the highest on record.[ii] However, when today’s temperature is compared with the Holocene Climate Optimum’s temperature 7,980 years ago, then that highest rise in temperature on record actually represents a decline of 1.90C. According to climate science experts who specialize in the Holocene Arctic climate, the Arctic temperatures was in general two to four degrees Celsius higher 8,000 to 5,000 years ago than it is today.[iii],[iv],[v]

The Arctic ice core data, like the Antarctic and global climate data, as well as the Northern Hemisphere insolation data (precession of the summer solstice),[vi],[vii],[viii],[ix] tells us emphatically that we have already entered an ice age (8,000 years ago). The Intergovernmental Panel on Climate Change’s anthropogenic global warming story started in 1880, and was “grafted on” to a trough-to-peak warming phase that started in 1700, and long before the anthropogenic influence became significant.

Click on this page and download a free copy of my book “Revolution: Ice Age Re-Entry,” and read more about this topic in Chapter 4.

[i]       Data: (1) B.M. Vinther et al., 2009, “Holocene thinning of the Greenland ice sheet.” Nature, Vol. 461, pp. 385-388, 17 September 2009. National Centers for Environmental Information, NESDIS, NOAA, U.S. Department of Commerce. Greenland Ice Sheet Holocene d18O, Temperature, and Surface Elevation. doi:10.1038/nature08355. https://www.ncdc.noaa.gov/paleo-search/study/11148. Downloaded 05/05/2018. (2) HadCRUT4 near surface temperature data set for the Northern Hemisphere. http://www.metoffice.gov.uk/hadobs/hadcrut4/data/current/download.html. Downloaded 25 July 2018.

[ii]      Global mean surface temperature data, commonly referred to as HadCRUT4. https://www.metoffice.gov.uk/hadobs/hadcrut4/data/current/download.html. [Exposé: Look at the bottom left hand or first column for the current year-to-date temperature. Subtract that from the 2016 total to see the magnitude of the fall. Global Data: https://bit.ly/2nCgctz. Northern Hemisphere Data: https://bit.ly/2MRt75G, Southern Hemisphere Data: https://bit.ly/2nBfYTA. Tropics Data: https://bit.ly/2nFXJMM. [last downloaded 25/07/2018].

[iii]     Nicolaj K. Larsen et al., “The response of the southern Greenland ice sheet to the Holocene thermal maximum.” Geology ; 43 (4): 291–294. doi: https://doi.org/10.1130/G36476.1.

[iv]     D.S. Kaufman et al., “Holocene thermal maximum in the western Arctic (0–1800W).” Quaternary Science Reviews 23 (2004) 529–560.

[v]      J.P. Briner et al., “Holocene climate change in Arctic Canada and Greenland.” Quaternary Science Reviews (2016), http://dx.doi.org/10.1016/j.quascirev.2016.02.010.

[vi]     H. Wanner et al., “Structure and origin of Holocene cold events.” Quaternary Science Reviews (2011), doi:10.1016/j.quascirev.2011.07.010. [Comment: See Figure 5a, page 9, depicting the steady decline in Northern Hemisphere summer solar insolation at north 15 and 65 degree latitudes, and indicating that insolation has declined by 40 W/m2. This is based on the landmark research by Berger, 1978 (André Berger, Long-Term Variations of Daily Insolation and Quaternary Climatic Changes. 1978. Journal of the Atmospheric Sciences 35(12):2362-2367. DOI: 10.1175/1520-0469(1978)035<2362:LTVODI>2.0.CO;2).].

[vii]    D.S. Kaufman et al., “Holocene thermal maximum in the western Arctic (0–180°W).” Quaternary Science Reviews, Volume 23, Issues 5–6, 2004, 529-560. https://doi.org/10.1016/j.quascirev.2003.09.007. [Comment: See the abstract. We are told that the precession-driven summer insolation anomaly peaked 12,000-10,000 years ago. See also Figure 9a which depicts the 65°N insolation anomaly at different times of the year, indicating an approximate 50 Wm-2 decline in summer solstice insolation from its peak 12,000-10,000 years ago.].

[viii]   Darrell Kaufman et al., “Recent Warming Reverses Long-Term Arctic Cooling.” September 2009. Science 325(5945):1236-1239. DOI: 10.1126/science.1173983. [Comment: This publication details the Arctic cooling that has been in progress for the last 2,000 years until this recent global warming phase. This millennial-scale cooling trend correlates (r = +0.87 with a R-squared 0.76, see Figure 4.) with a reduction in precession of the solstice driven summer insolation (6 W m−2 insolation at 65°N) for the last 2,000 years. See Figure 3F. The publication indicates a temperature decline of 0.22° ± 0.06°C per 1000 years, which tracks the slow decline in orbitally driven summer insolation at high northern latitudes.].

[ix] I. Borzenkova et al., 2015. Climate Change During the Holocene (Past 12,000 Years). In: The BACC II Author Team (eds) Second Assessment of Climate Change for the Baltic Sea Basin. Regional Climate Studies. Springer. https://link.springer.com/content/pdf/10.1007%2F978-3-319-16006-1.pdf
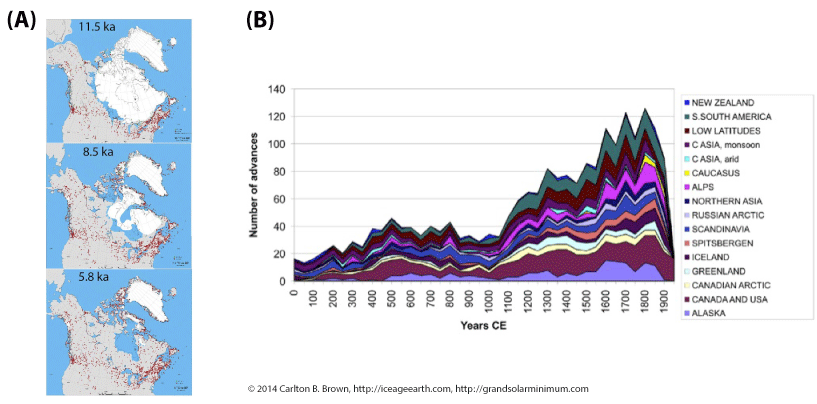
There was less ice at the Holocene Climate Optimum than today

There was less ice at the Holocene Climate Optimum than today

Images: A) This image presents three smaller images (from 15) extracted from a time series of the Laurentide and Greenland ice sheets straddling the Holocene Climate Optimum. The complete time series shows a stepwise reduction in ice extent from 11,500 years ago to its minimum extent 5,800 years ago.[i] B) This image shows a stacked time series of glacier advances and retractions during the last two millennia. A small number of glacier advances occurred in many regions between the first and twelfth centuries CE. There was then a sharp increase in the number of glacier advances from the 13th century to the mid-19th century.[ii] During the Little Ice Age winter sea ice closed off previously accessible sea routes between Scandinavia and Greenland.[iii]

Beginning in the mid-19th century, as temperatures increased again, glacier ice began to melt, with this accelerating over the past five decades.[iv],[v],[vi] Based on the second image, we can appreciate that a significant part of the last two millennia of ice accumulation has melted since the mid-19th century.

The key take-home message is that there was less glacier ice in the Arctic at the Holocene Climate Optimum than exists today. Ice then began to accumulate starting about five millennia ago, accelerating through the Little Ice Age in an oscillatory manner until the mid-19th century. The ice melt since the mid-19th century happened during the current global warming phase, or the trough-to-peak warming phase that started in 1700 CE. With most of the last two millennia of ice accumulation having melted recently, it is difficult for us to perceive the correct stage of the glacial cycle that we are living in.

Click on this page and download a free copy of my book “Revolution: Ice Age Re-Entry,” and read more about this topic in Chapter 3.

[i]       Jason P. Briner et al., “Holocene climate change in Arctic Canada and Greenland.” Quaternary Science Reviews, Volume 147, 2016, 340-364, ISSN 0277-3791. https://doi.org/10.1016/j.quascirev.2016.02.010.

[ii]       O.N. Solomina et al., 2016, “Glacier fluctuations during the past 2000 years.” Quaternary Science Reviews, 149, 61-90. DOI: 10.1016/j.quascirev.2016.04.008. [See Figure 5, page 276. This figure collates a stacked time series of the number of glacier advances and recessions in each region into a global total.].

[iii]      Michael E Mann, “Little Ice Age.” Volume 1, The Earth system: physical and chemical dimensions of global environmental change, 504–509. In Encyclopedia of Global Environmental Change (ISBN 0-471-97796-9).

[iv]      Leonid Polyak et al., “History of sea ice in the Arctic.” Quaternary Science Reviews 29 (2010) 1757–1778, https://doi.org/10.1016/j.quascirev.2010.02.010

[v]       Christophe Kinnard et al., “A changing Arctic seasonal ice zone: Observations from 1870–2003 and possible oceanographic consequences.” Geophysical Research Letters, Volume 35, L02507, doi:10.1029/2007GL032507, 2008.

[vi]      O.N. Solomina et al., 2016, “Glacier fluctuations during the past 2000 years.” Quaternary Science Reviews, 149, 61-90. DOI: 10.1016/j.quascirev.2016.04.008. [See Figure 5, page 276. This figure collates a stacked time series of the number of glacier advances and recessions in each region into a global total.].

Pin It on Pinterest