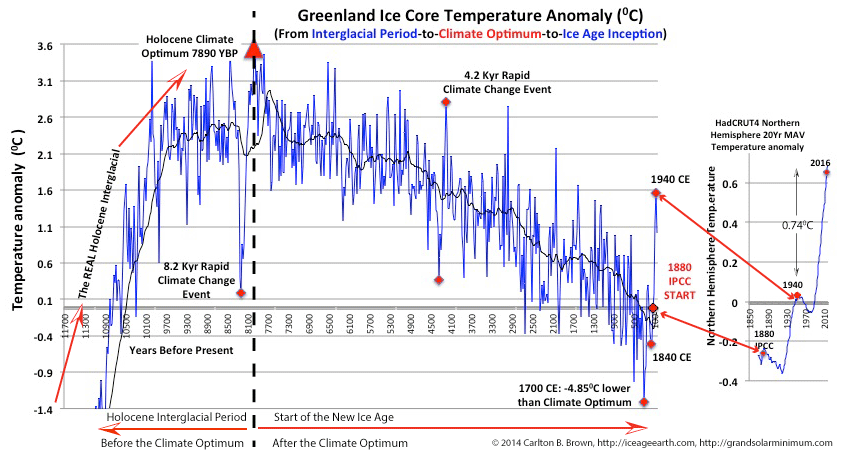
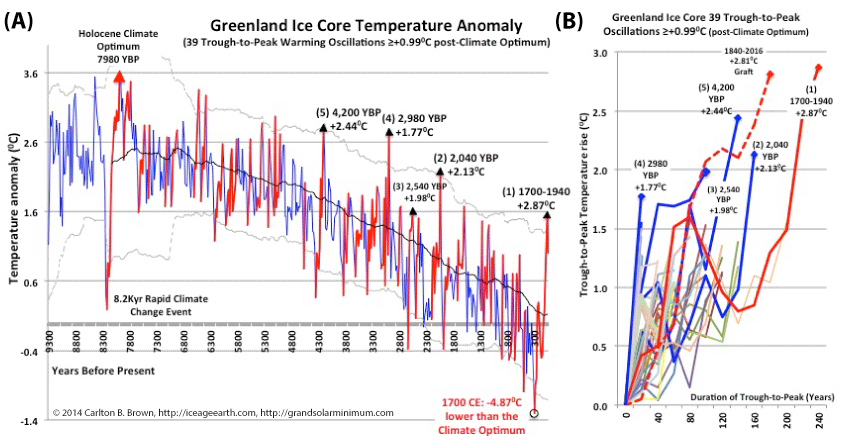
Figures A) Thirty-nine trough-to-peak temperature rises exceeding 0.990C (red segments) between 7980 years ago and 1960 were extracted from the Greenland ice core for analysis. To help visualize statistical outliers, upper/lower Bollinger bands (pale grey) are used to highlight the peaks and troughs falling outside two standard deviations (95% confidence limits relative to a 60-period moving average, black line). The 39 trough-to-peak rises (warming phases) were not normally distributed and were therefore stratified into two groups (Group 2 ≤ 1.770C and Group 1 ≥ 1.770C) based on goodness-of-fit and outlier tests. The outlier test highlighted that those peaks rising more than 1.770C were significant outliers, and that the 2.870C rise from 1700-1940 was the biggest outlier or most extreme warming phase. This stratification yielded two normally distributed groups that were significantly different from one another. B) This figure graphically displays the 39 trough-to-peak warming phases (rebased) plus a grafted peak +2.810C (1840-2016 CE). Group 1 outliers are blue and red (extreme outliers).[i]
Groups 1 and 2 were also compared for their magnitude of temperature decline from the temperature peak upon climate switching, and the time taken to reach the first post-peak and the final trough. Group 1 (the big outlier peaks ≥ 1.770C) dropped rapidly to its maximum decline of 1.920C within 40 years, whereas Group 2 declined 1.030C in a similar timeframe. This difference in temperature decline was statistically significant (see the citation).[ii]
The conclusion I drew from this analysis was two-fold. Firstly, there is a greater probability the climate will switch back to a cooling phase than continuing its rise throughout the 21st century. Secondly, the bigger the trough-to-peak warming phase, the greater the magnitude of temperature drop and the more abruptly it falls from peak-to-trough after the climate switches (i.e., within 40 years). The implication for this current 1700-2016 most extreme warming phase is that the climate will switch back to a cooling phase, and the temperature will decline abruptly.
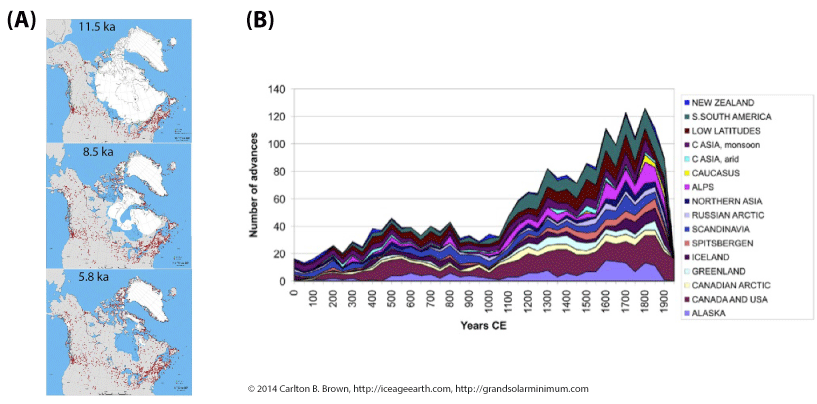
Interestingly, some of the Arctic’s coldest periods, biggest glacier advances, and important rapid cooling events since the Holocene Climate Optimum are included in Group 1.[iii],[iv],[v] These rapid climate change events triggered major famines and decimated ancient human civilizations. The 4,200-year event, included in Group 1, is well studied and was associated with the collapse of Egypt’s Old Kingdom,[vi],[vii] Mesopotamia’s Akkadian Empire,[viii] and the Indus Valley (or Harappan) Culture.[ix]
The 4,200-year rapid climate change event was characterized by a deep temperature trough preceding this event, with the temperature then rising from trough-to-peak by 2.440C. This was the Holocene’s second biggest trough-to-peak outlier warming phase. This high temperature peak (higher than today) then abruptly switched to a cooling phase, and civilizations collapsed. Of all the large-scale climate fluctuations since the Holocene Climate Optimum (as revealed by the Greenland ice core data), this 4.2-kiloyear centennial-scale climate oscillation is the one most similar to the 1700-2016 trough-to-peak warming phase.
Click on this page and download a free copy of my book “Revolution: Ice Age Re-Entry,” and read more about this topic in Chapter 4.
[i] Data: (1) B.M. Vinther et al., 2009, “Holocene thinning of the Greenland ice sheet.” Nature, Vol. 461, pp. 385-388, 17 September 2009. National Centers for Environmental Information, NESDIS, NOAA, U.S. Department of Commerce. Greenland Ice Sheet Holocene d18O, Temperature, and Surface Elevation. doi:10.1038/nature08355. https://www.ncdc.noaa.gov/paleo-search/study/11148. Downloaded 05/05/2018. (2) HadCRUT4 near surface temperature data set for the Northern Hemisphere. http://www.metoffice.gov.uk/hadobs/hadcrut4/data/current/download.html. Downloaded 25 July 2018. Personal Research: All 39 climate trough-to-peak temperature rises exceeding +0.990C, between 5980 BCE and 1940 CE were extracted from the temperature data, derived from the Greenland ice core, for group analysis (range, +0.990C to +2.870C, average 77.4 years trough-to-peak, n=39). These trough-to-peak temperature increases selected trough-to-peaks to start from the deepest time point in the maximum trough preceding the tallest peak. A goodness-of-fit test of all 39 trough-to-peak temperature rises showed that the data did not follow a normal distribution. This indicates the possibility that more than one global warming process may be involved with the bigger climate oscillation outliers (i.e., an extreme grand solar maxima). Results: Prior to stratifying the data an Iglewicz and Hoaglin’s robust test (two-sided test) for multiple outliers was performed using a modified Z score of ≥1.5 and ≥5 as the outlier criteria. The modified Z score of ≥1.5 highlighted significant outliers above +1.770C. A higher modified Z score of ≥5 yielded the most extreme outlier the +2.870C trough-to-peak between 1700 and 1940. Given the outliers that were revealed, the data was stratified into two groups (0.990C – 1.770C or ≥ 1.770C). This stratification yielded 2 normally distributed groups (Group-1, N=5, Group-2 N=34), that were, statistically, significantly different from one another (unpaired Welch T-Test, 2-tailed P-value = 0.007). Group 1’s smallest temperature rise was 0.210C greater than Group 2’s largest temperature rise, highlighting the gap between the two groups. On the basis of the above, the peak-to-trough temperature rise from 1700 to 1940 (+2.870C) was confirmed as the most significant outlier. This process was repeated for the grafted peak from 1840-2016 (+2.810C) as detailed in Figure 4.1. Group-1 swapped the +2.870C with the +2.810C, which was also statistically, significantly different from Group-2 (unpaired Welch T-Test, two-sided P-value = 0.0061). Conclusion: Group-1 (N=5) composed of trough-to-peak outliers ≥ 1.770C were significantly larger global warmings than Group-2 (N=34), and the +2.870C or +2.810C were the largest outliers.
[ii] Data: (1) B.M. Vinther et al., 2009, “Holocene thinning of the Greenland ice sheet.” Nature, Vol. 461, pp. 385-388, 17 September 2009. National Centers for Environmental Information, NESDIS, NOAA, U.S. Department of Commerce. Greenland Ice Sheet Holocene d18O, Temperature, and Surface Elevation. doi:10.1038/nature08355. https://www.ncdc.noaa.gov/paleo-search/study/11148. Downloaded 05/05/2018. Personal Research: Groups 1 and 2 (previous citation) were compared by their magnitudes of decline from the temperature peak to see if there was a difference between them once the climate switched to a cooling phase. The time to reach the first post-peak trough, and to their maximum troughs was calculated. Each group had a normal distribution (d’Agostino-Pearson test and Shapiro-Wilks test: P>0.05) but a different variance. As such a Welch T-test (unpaired) was used to assess group differences. Results: Group 1 (≥1.770C trough-to-peak) showed a mean temperature decline at the 1st trough after the peak of 1.920C versus Group 2’s (≤1.770C trough-to-peak) mean temperature decline of 1.030C, which represented a statistically significant difference in temperature decline over Group 1 (2-tailed P-value = 0.0433). Group 1 showed a mean temperature decline at the maximum trough after the peak of 1.920C versus Group 2’s mean temperature decline of 1.230C, but this difference was not significantly different (-0.690C, P-value 0.0784). Moreover, Group 1 rapidly declined such that its first post-peak trough was the same as its maximum trough i.e., Group 1 temperature fell abruptly. Group 2 showed a difference between its first and maximum trough of -0.200C, which was significantly different (P-value = 0.001928). Group 1 took two intervals (i.e., 45 years) to drop -1.920C with its first and maximum trough being the same (-1.920C). By contrast, Group 2 took on mean 1.82 intervals (i.e., 36 years) to reach its first trough and 3.15 intervals (i.e., 63 years) to reach its deepest trough. Conclusion: The higher the preceding trough-to-peak temperature rise (statistical outlier, or tall temperature peaks) the greater and more abrupt the temperature falls to near its maximum trough when the climate switches.
[iii] Olga N. Solomina et al., “Holocene glacier fluctuations.” Quaternary Science Reviews. Volume 111, 2015, 9-34. https://doi.org/10.1016/j.quascirev.2014.11.018.
[iv] C. Andersen et al., “A highly unstable Holocene climate in the subpolar North Atlantic: evidence from diatoms.” Quaternary Science Reviews, Volume 23, Issues 20–22, 2004, 2155-2166. https://doi.org/10.1016/j.quascirev.2004.08.004.
[v] H. Wanner et al., “Structure and origin of Holocene cold events.” Quaternary Science Reviews (2011), doi:10.1016/j.quascirev.2011.07.010.
[vi] Robert K. Booth et al., “A severe centennial-scale drought in midcontinental North America 4200 years ago and apparent global linkages.” The Holocene. Volume 15, Issue 3, 321 – 328. 2005. https://doi.org/10.1191/0959683605hl825ft.
[vii] J. Stanley et al., 2003, “Nile flow failure at the end of the Old Kingdom, Egypt: Strontium isotopic and petrologic evidence.” Geoarchaeology, 18: 395-402. doi:10.1002/gea.10065.
[viii] Ann Gibbons, “How the Akkadian Empire Was Hung Out to Dry”. Science 20 Aug 1993: Volume 261, Issue 5124, DOI: 10.1126/science.261.5124.985.
[ix] Jianjun Wang, “The abrupt climate change near 4,400 year BP on the cultural transition in Yuchisi, China and its global linkage.” Scientific Reports | 6:27723 | DOI: 10.1038/srep27723. https://www.nature.com/articles/srep27723.pdf.

Recent Comments