A grand solar minimum represents a magnetically quiet sun

A grand solar minimum represents a magnetically quiet sun

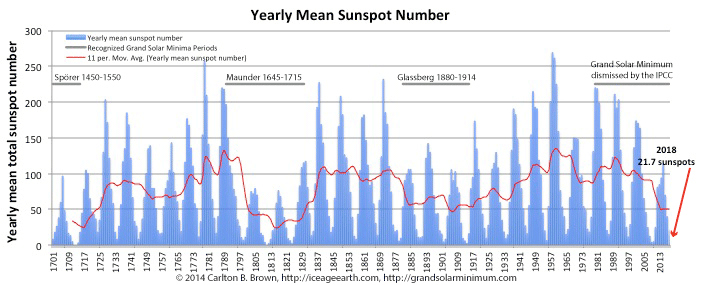
Yearly mean sunspot numbers covering Solar Cycles 1-24 between 1700 and 2018. This highlights an approximate 11-year solar cycle duration, and that the peak sunspot number for each 11-year solar cycle vary over longer-term cycles. The peaks and troughs of these longer-term solar cycles are referred to as grand solar maxima and minima respectively.[i] Sunspot numbers during the 11-year solar cycle have been in decline since the late 1980s. Solar Cycle 24 is progressing toward a grand solar minimum in terms of sunspot numbers.

How do solar cycles and grand solar minima arise?

The sun physically oscillates around the solar system’s center of mass on its journey through galactic space. This wobble effect on the solar system’s center of mass is due to the gravitational and angular momentum impact of the giant planets, specifically Jupiter and Saturn. This wobble effect results in a number of periodic oscillations in the movement of the sun about the solar system’s center of mass.[ii],[iii],[iv]

Physical forces operating between the planets as they orbit the sun also affect the rate at which planets rotate, and the sun’s rate of rotation as well. Cycles of differential rotation by the sun are thus established, which then determine the multiple periodicities of the sun’s activity. Earth’s rate of rotation is also subject to these same planetary forces acting on the sun.[v]

This planetary influence on the sun’s motion around the solar system’s center of mass perturbs the sun’s internal solar dynamo processes. The solar dynamo is responsible for generating the sun’s magnetic fields. Cycles of solar activity therefore manifest in sunspots, solar flares, solar irradiance, coronal mass ejections, and the sun’s magnetic fields emanating into space (magnetized solar wind).[vi]

Sunspot numbers rise and fall over an 11-year cycle (see above), and these sunspots can be observed on the surface of the sun as dark discs. The current Solar Cycle 24 began in January 2008.[vii] This is the third 11-year cycle in a row since the peak of Cycle 21 in the late 1980s with diminishing peak sunspot numbers.[viii]

These diminishing peaks and troughs of solar activity highlight the influence of longer-term solar cycles that impact the magnitude of the 11-year solar cycle (sunspot numbers), and indicate that the sun is moving into a grand solar minimum phase. These longer-term cycles include the Gleissberg (50–80 and 90–140 year periods) and Suess cycles (170–260 year periods).[ix] At this stage of the glacial cycle, the sun spends about twice the time in grand solar minima compared with grand solar maxima.[x]

Click on this page and download a free copy of my book “Revolution: Ice Age Re-Entry,” and read more about this topic in Chapter 6.


[i]       Sunspot data from the World Data Center SILSO, Royal Observatory of Belgium, Brussels. http://sidc.be/silso/datafiles#total. [Data: Yearly mean sunspot numbers from 1700 to the present. Downloaded 05/05/2018.].

[ii]      N.A. Mörner et al., “General conclusions regarding the planetary–solar–terrestrial interaction.” Pattern Recognition Physics, 1, 205–206, 2013. www.pattern-recogn-phys.net/1/205/2013/. doi:10.5194/prp-1-205-2013.

[iii]     J.E. Solheim, “The sunspot cycle length – modulated by planets?” Pattern Recognition Physics, 1, 159–164, 2013. www.pattern-recogn-phys.net/1/159/2013/. doi:10.5194/prp-1-159-2013.

[iv]     I.R.G. Wilson et al., “Does a Spin-Orbit Coupling Between the Sun and the Jovian Planets Govern the Solar Cycle?” Astronomical Society of Australia, Volume 25, Issue 2, 85-93. DOI:10.1071/AS06018.

[v]      R. Tattersall, 2013, “Apparent relations between planetary spin, orbit, and solar differential rotation.” Pattern Recognition in Physics, 1 (1). 199 – 202. https://doi.org/10.5194/prp-1-199-2013.

[vi]     Katya Georgieva, “Effects of interplanetary disturbances on the Earth’s atmosphere and climate.” http://www.issibern.ch/teams/interplanetarydisturb/wp-content/uploads/2014/01/proposal.pdf.

[vii]    European Space Agency, “SOHO, New Solar Cycle Starts with a Bang.” http://www.esa.int/Our_Activities/Space_Science/SOHO_the_new_solar_cycle_starts_with_a_bang.

[viii]   Sunspot data from the World Data Center SILSO, Royal Observatory of Belgium, Brussels. http://sidc.be/silso/datafiles#total. [Data: Based on the Yearly mean sunspot number. The 1980 (1979.5) peak sunspot number was 220, 1990 (1989.5) peak 211, 2001 (2000.5) peak 174, 2015 (2014.5) peak 113. Downloaded 05/05/2018.].

[ix]     M.G. Ogurtsov et al., Long-Period Cycles of the Sun’s Activity Recorded in Direct Solar Data and Proxies. Solar Physics (2002) 211: 371. https://doi.org/10.1023/A:1022411209257.

[x]      I.G. Usoskin et al., “Grand minima and maxima of solar activity: new observational constraints.” Astron.Astrophys.471:301-309,2007. DOI:10.1051/0004-6361:20077704.

This grand solar minimum portends catastrophic climate-forcing volcanic eruptions

This grand solar minimum portends catastrophic climate-forcing volcanic eruptions

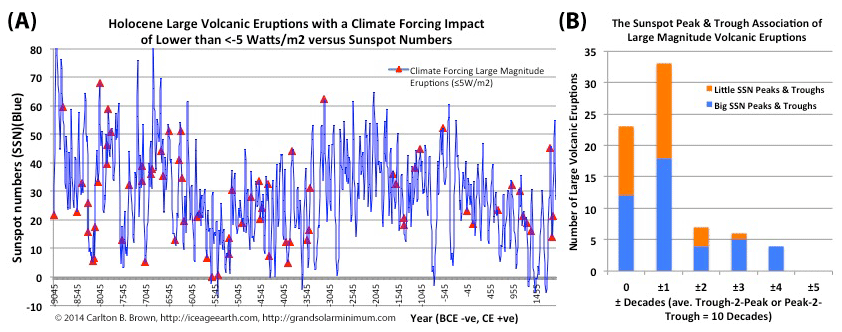
Figure A) A quantitative filter was applied to a National Oceanic and Atmospheric Administration (NOAA) volcanic eruption data reconstruction (see citation methodology). This volcanic eruption data was derived from Greenland’s GISP2 sulphate record and was used to estimate the number of volcanic eruption events. In this manner, the 73 largest climate-forcing volcanic eruptions were selected covering the last 11,000 years. All 73 large magnitude volcanic eruptions were plotted against the sunspot numbers (NOAA provided). Figure B) Seventy-seven percent (56/73) of climate-forcing volcanic eruptions occurred at or within a decade of a grand solar minimum (i.e., a deep sunspot number trough) or grand solar maximum (i.e., a large sunspot number peak), or within a decade of a smaller trough or peak going into or coming out of a grand solar minimum. This resulted in the skewed distribution of the eruptions in the zero and ±1 decade groups relative to the ±2–5 decade groups. This above described relationship is not evident for smaller volcanic eruptions. Three-quarters of these large climate-forcing eruptions occurred when the 500-year average sunspot number fell below 37.[i]

A similar result was obtained by plotting the 67 total Volcanic Explosivity Index 6 and 7 eruptions (scale of 1 to 8, with 7 being Rinjani or Tambora-like i.e., globally catastrophic) from the Volcano Global Risk Identification and Analysis Project (VOGRIPA) database against 11,000 years of sunspot numbers. This analysis showed that 82 percent of all VEI 6 or 7 events occurred at or within a decade of a sunspot number peak or trough. Three-quarters of these VEI 6 and 7 events occurred when the 500-year average sunspot number fell below 34.[ii]

Grand solar minima and maxima (±1 decade) represent high-risk periods for climate-forcing volcanic eruptions. Earth has entered a high-risk grand solar minimum period for climate-forcing volcanic eruptions—the kind that cools the planet, and causes centennial-scale glacier ice accumulation and global famine.

When viewing Figure A above, which depicts sunspot numbers between 9104 BCE and 1895 CE, it becomes obvious that sunspot cycles constitute a natural oscillator (more frequently associated with climate forcing volcanic eruptions). The mean sunspot number trough-to-peak or peak-to-trough duration was ten decades (standard deviation 4.7 and range 3–25 decades). This solar activity oscillator is similar to the temperature oscillations (and durations) evident in the Arctic ice core temperature data,[iii] albeit the two are not always in phase with each other. The duration of both the larger sunspot number oscillation and larger temperature oscillations is typically one to two centuries from trough-to-trough.

Could grand solar minima and maxima of sunspot numbers (solar magnetism) be an important cause of centennial-scale climate oscillations and centennial-scale glacier ice accumulation? What is very clear from the data is that the sun has multiple levers on the climate system, to control millennial-, centennial-, and decadal-scale climate change and climate risks.

Click on this page and download a free copy of my book “Revolution: Ice Age Re-Entry,” and read more about this topic in Chapter 5 and answers to the above question.


[i]       Data: (1) Takuro Kobashi et al., 2017, “Volcanic influence on centennial to millennial Holocene Greenland temperature change.” Scientific Reports, 7, 1441. doi: 10.1038/s41598-017-01451-7. Data provided by the National Centers for Environmental Information, NESDIS, NOAA, U.S. Department of Commerce. https://www.ncdc.noaa.gov/paleo-search/study/22057. Data accessed 21/08/2018. (2) Solanki, S.K., et al. 2004. “An unusually active Sun during recent decades compared to the previous 11,000 years.” Nature, Volume 431, No. 7012, 1084-1087, 28 October 2004. Data: Solanki, S.K., et al. 2005. “11,000 Year Sunspot Number Reconstruction.” IGBP PAGES/World Data Center for Paleoclimatology. Data Contribution Series #2005-015. NOAA/NGDC Paleoclimatology Program, Boulder CO, USA. https://www.ncdc.noaa.gov/paleo-search/study/5780. Downloaded 05/06/2018. Personal Research: Figure 5.1.A: Using the above-cited climate-forcing volcanic eruption data a quantitative filter was utilized to identify the largest climate forcing eruptions, and to group all eruption events into climate-forcing categories. Each volcanic eruption started with the first data point in a group series, and this group series magnitude was represented by the maximum volcanic forcing magnitude data point (i.e., the most negative Watts/meter-squared value) for that group series (i.e., a 1-year value from within a range of 1-10 years). This was completed for the entire time series (11,054 years). In this manner 403 volcanic events were identified over 11,054 years. The eruption events were preliminarily assigned to groups based on their maximum solar forcing impact, as follows: Group-1, ≤-10 W/m2 (N=23). Group-2, -5 to <-9.99 W/m2 (N=50). Group-3, -2 to <-4.99 W/m2 (N=89). Group-4, 0 to <-1.99 W/m2 (N=241). Volcanic events were then grouped and compiled into 500, 400, and 300 year bin totals spanning the last 5,000, 8,000, and 11,000 years. The average sunspot numbers were calculated for each bin period. A goodness of fit and outlier tests were conducted for all groupings. Pearson and Spearman rank correlations and their significance levels were calculated for each 5,000, 8,000, and 11,000 year periods to help understand if significant relationships existed or not. Results: The 500-year bin totals generated the highest and most significant correlations, and the 8,000 and 5,000 year periods maximized the correlation coefficients. The correlation values were reduced for 11,000-year period versus the 8,000-year period, and were marginally smaller for 400-year bins, and much smaller for 300-year bins (Data not shown) compared with the 500-year bins. On this basis, the 8,000-year duration and 500-year bin totals represented the optimum grouping which maximized the duration of the relationship i.e., since the Holocene Climate Optimum. The 8,000-year data summary is tabulated above (at the start of the endnotes, referencing this endnote). The outcome of this analysis was to compile Groups 1 and 2 into a single group and set the climate forcing eruption threshold at ≤ -5.0 Watts/meter-squared i.e., large volcanic eruptions. All 73 large climate-forcing volcanic eruptions were plotted against the above-cited Solanki et al. sunspot numbers to produce Figure 5.1.A’s graphic. Figure 5.1.B: The 73 climate-forcing eruptions selected above were tabulated alongside the above-cited Solanki et al. sunspot numbers in the year of the eruption’s occurrence. The number of periods (at a 10-year resolution) was counted to the previous or next big (grand solar) and small (sub-) peak or trough for all eruption events. An eruption was then assigned to a big or little peak or trough based on its closest proximity to one of those events. Each eruption was only counted once. The data was used to derive Figure 5.1.B, and is tabulated above at the start of the endnotes (referencing this endnote).

[ii]       Data: (1) Helen Sian Crosweller et al., “Global database on large magnitude explosive volcanic eruptions (LaMEVE).” Journal of Applied Volcanology Society and Volcanoes 20121:4. https://doi.org/10.1186/2191-5040-1-4. Volcano Global Risk Identification and Analysis Project database (VOGRIPA), British Geological Survey. Data Access: http://www.bgs.ac.uk/vogripa/. Data downloaded 07/05/2018. (2) S.K. Solanki et al., 2004, “An unusually active Sun during recent decades compared to the previous 11,000 years.” Nature, Volume 431, No. 7012, 1084-1087, 28 October 2004. Data: S.K. Solanki et al., 2005, “11,000 Year Sunspot Number Reconstruction.” IGBP PAGES/World Data Center for Paleoclimatology. Data Contribution Series #2005-015. NOAA/NGDC Paleoclimatology Program, Boulder CO, USA. https://www.ncdc.noaa.gov/paleo-search/study/5780. Downloaded 05/06/2018. Personal Research: A total of 67 VEI 6 and 7 eruptions were extracted from the LaMEVE database. These were plotted alongside the above-cited Solanki et al. sunspot numbers. The number of 10-year periods was counted from each eruption to the previous or next sunspot number peak or trough. The data is tabulated above, at the start of the endnotes and referencing this endnote. Results: 82 percent of VEI 6-7 eruptions occurred at or within one decade of a sunspot number peak or trough. This peak and trough occurrence coincides with either a grand solar maximum or minimum, or a smaller sub-peak or sub-trough of sunspot numbers.

[iii]     B.M. Vinther et al., 2009, “Holocene thinning of the Greenland ice sheet.” Nature, Vol. 461, pp. 385-388, 17 September 2009. National Centers for Environmental Information, NESDIS, NOAA, U.S. Department of Commerce. Greenland Ice Sheet Holocene d18O, Temperature, and Surface Elevation. doi:10.1038/nature08355. https://www.ncdc.noaa.gov/paleo-search/study/11148. Downloaded 05/05/2018.

Climate-forcing volcanic eruptions during the Little Ice Age’s grand solar minima

Climate-forcing volcanic eruptions during the Little Ice Age’s grand solar minima

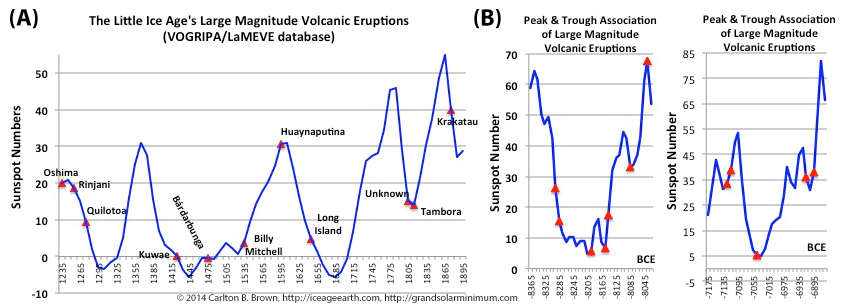
Figure 5.2. A) VOGRIPA’s database of large magnitude volcanic eruptions (VEI 6 or 7), associated with the Little Ice Age were plotted against sunspot numbers.[i] The VEI 7 Rinjani volcanic eruption occurred at the grand solar maximum just prior to the Wolf minimum. You can see how 5 of the 11 large magnitude volcanic eruptions took place at or near the troughs of these grand solar minima periods. A further 3 of 11 large magnitude volcanic eruptions (VEI 6 or 7) occurred half way into a grand solar minimum, while the remaining 3 of 11 eruptions occurred at grand solar maximum sunspot peaks. B) These two figures highlight the association of large magnitude volcanic eruptions with grand solar maxima and minima (i.e., big peaks and deep troughs of sunspot numbers), as well as with the smaller peaks and troughs. The first of these two figures coincides with the 8.2-kiloyear rapid climate change event, the most abrupt and deepest cooling event in the last 8,500 years, which left its imprint in the climate record around the world.[ii],[iii],[iv],[v]

I conclude that grand solar minima and maxima represent high-risk periods associated with the “triggering” of climate-forcing volcanic eruptions.

Large magnitude volcanic eruptions trigger atmospheric and ocean circulatory system responses in the years following such an event. These can then induce longer-lived (decade to multi-decade) changes in the Arctic’s and North Atlantic’s climate. This in turn can have a major impact on the global ocean temperatures for several decades, which can lead to centennial-scale increases in the Northern Hemisphere’s glacier and sea ice.[vi],[vii],[viii],[ix],[x]

Scientists expert in volcanic activity-induced climate change (see the next paragraph’s citations) believe the Little Ice Age was caused by periods of abrupt and persistent summer cooling in the late 13th century and middle of the 15th century. These periods coincided with two of the most volcanically active half-centuries of the last millennium. The Little Ice Age also coincided with four successive grand solar minima, starting with the Wolf minimum in 1280.

A large magnitude volcanic eruption is believed to have triggered the Little Ice Age (Rinjani in 1257, a VEI 7 event),[xi] which was then followed by other large magnitude volcanic eruptions, roughly one every decade. These eruptions collectively resulted in volcanic sulfate levels during the 13th century (as revealed by ice core data) that was many times greater than in any other century during the last millennia. The cold periods resulting from this 13th century large-magnitude volcanism had an impact on the climate that was sustained over centennial timescales, and long after the eruptions’ volcanic aerosols were gone from the atmosphere.[xii],[xiii],[xiv],[xv],[xvi]

Low solar activity-induced alterations of atmospheric circulations are thought to play an important role in glacier and sea ice expansion processes.[xvii] The North Atlantic Oscillation is a dominant Northern Hemisphere atmospheric circulation, and is the key determinant of the winter climate over the North Atlantic.[xviii],[xix],[xx],[xxi],[xxii],[xxiii],[xxiv] A prolonged negative phase of the North Atlantic Oscillation was experienced during the Little Ice Age, which was associated with increased ice accumulation during the Little Ice Age.[xxv],[xxvi]

Importantly, the North Atlantic Oscillation is coupled to the upper atmosphere (i.e., the stratosphere) by some complex physical processes,[xxvii],[xxviii] and its phase and strength are correlated with geomagnetic activity (i.e., earth magnetism), which is known to be modified by magnetized solar wind.[xxix],[xxx],[xxxi] The North Atlantic Oscillation is also modified by changes in the loading of the stratosphere with volcanic aerosols.[xxxii],[xxxiii]

The above paragraphs collectively highlight that climate-forcing volcanism and the North Atlantic Oscillation were instrumental in the Little Ice Age’s cold climate and ice accumulation mechanism. This mechanism led to an increase in sea ice entering the sub-polar North Atlantic region from the Arctic (referred to as “sea ice exports”). These sea ice exports in turn weakened the North Atlantic branch of the Atlantic thermohaline circulation (i.e., a salt concentration and temperature-driven ocean circulation system), and reduced warm water entry into the Arctic region. The increased sea ice exports and changes to the ocean circulation system “reinforced” the ice generating process, which led to centennial-scale glacier ice expansion in the Arctic (viz. glacier ice expansion mechanism).[xxxiv],[xxxv],[xxxvi],[xxxvii],[xxxviii]

Click on this page and download a free copy of my book “Revolution: Ice Age Re-Entry,” and read more about this topic in Chapter 5.

[i]       Data: (1) Helen Sian Crosweller et al., “Global database on large magnitude explosive volcanic eruptions (LaMEVE).” Journal of Applied Volcanology Society and Volcanoes 20121:4. https://doi.org/10.1186/2191-5040-1-4. Volcano Global Risk Identification and Analysis Project database (VOGRIPA), British Geological Survey. Data Access: http://www.bgs.ac.uk/vogripa/. Data downloaded 07/05/2018. (2) S.K. Solanki et al., 2004, “An unusually active Sun during recent decades compared to the previous 11,000 years.” Nature, Volume 431, No. 7012, 1084-1087, 28 October 2004. Data: Solanki, S.K., et al. 2005. 11,000 Year Sunspot Number Reconstruction. IGBP PAGES/World Data Center for Paleoclimatology. Data Contribution Series #2005-015. NOAA/NGDC Paleoclimatology Program, Boulder CO, USA. https://www.ncdc.noaa.gov/paleo-search/study/5780. Downloaded 05/06/2018. (3) Takuro Kobashi et al., 2017, “Volcanic influence on centennial to millennial Holocene Greenland temperature change.” Scientific Reports, 7, 1441. doi: 10.1038/s41598-017-01451-7. Data provided by the National Centers for Environmental Information, NESDIS, NOAA, U.S. Department of Commerce. https://www.ncdc.noaa.gov/paleo-search/study/22057. Data accessed 21/08/2018. Personal Research: (1) Figure 5.2.A: The 11 total VEI 6 and 7 eruptions between 1235 and 1885 were extracted from the LaMEVE database and graphically plotted as discrete events on the above-cited Solanki et al. sunspot number data within this same period. In this manner, the occurrence of VEI 6-7 eruptions can be viewed relative to the grand solar maximum or minimum, or a smaller sub-peak or sub-trough of sunspot numbers going into or coming out of a grand solar minimum trough. (2) Figure 5.2.B: Two periods running from grand solar maxima-to-minima-to-maxima were extracted from the above-cited Solanki et al. sunspot number data. The corresponding climate forcing volcanic eruptions from the Takuro Kobashi, et al. volcanic eruption data (the same as utilized for Figure 5.1.A) were plotted in the periods that they occurred. This highlights the association of large climate-forcing volcanic eruptions with either a grand solar maximum or minimum, or a smaller sub-peak or sub-trough of sunspot numbers going into or coming out of a grand solar minimum.

[ii]      R. B. Alley et al., “Holocene climatic instability: A prominent, widespread event 8200 year ago.” Geology ; 25 (6): 483–486. doi: https://doi.org/10.1130/0091-7613(1997)025<0483:HCIAPW>2.3.CO;2.

[iii]     Kaarina Sarmaja-Korjonen and H. Seppa, 2007, “Abrupt and consistent responses of aquatic and terrestrial ecosystems to the 8200 cal. year cold event: a lacustrine record from Lake Arapisto, Finland”. The Holocene 17 (4): 457–467. doi:10.1177/0959683607077020.

[iv]     D.C. Barber et al., 1999, “Forcing of the cold event of 8,200 years ago by catastrophic drainage of Laurentide lakes.” Nature Volume 400, 344–348 (22 July 1999). doi:10.1038/22504.

[v]      Christopher R W Ellison et al., 2006, “Surface and Deep Ocean Interactions During the Cold Climate Event 8200 Years Ago.” Science. 2006 Jun 30;312(5782):1929-32. DOI10.1126/science.1127213.

[vi]     J. Slawinska and A. Robock, 2018, “Impact of Volcanic Eruptions on Decadal to Centennial Fluctuations of Arctic Sea Ice Extent during the Last Millennium and on Initiation of the Little Ice Age.” J. Climate, 31, 2145–2167, https://doi.org/10.1175/JCLI-D-16-0498.1.

[vii]    Didier Swingedouw et al., 2015, “Bidecadal North Atlantic ocean circulation variability controlled by timing of volcanic eruptions.” Nature Communications. 6:6545 | DOI: 10.1038/ncomms7545.

[viii]   D.O. Zanchettin et al., 2013, “Background conditions influence the decadal climate response to strong volcanic eruptions.” Journal of Geophysical Research Atmos., 118, 4090–4106, doi:10.1002/jgrd.50229.

[ix]     Y. Zhong et al., “Centennial-scale climate change from decadally-paced explosive volcanism: a coupled sea ice-ocean mechanism.” Climate Dynamics (2011) 37: 2373. https://doi.org/10.1007/s00382-010-0967-z.
[x]      G.H. Miller et al., 2012, “Abrupt onset of the Little Ice Age triggered by volcanism and sustained by sea-ice/ocean feedbacks.” Geophysical Research Letters, 39, L02708, doi:10.1029/2011GL050168.

[xi]     C. Newhall et al., 2018, Anticipating future Volcanic Explosivity Index (VEI) 7 eruptions and their chilling impacts: Geosphere, v. 14, no. 2, p. 1–32, doi:10.1130/GES01513.1.

[xii]    J. Slawinska and A. Robock, 2018, “Impact of Volcanic Eruptions on Decadal to Centennial Fluctuations of Arctic Sea Ice Extent during the Last Millennium and on Initiation of the Little Ice Age.” J. Climate, 31, 2145–2167, https://doi.org/10.1175/JCLI-D-16-0498.1.

[xiii]   G. H. Miller et al., 2012, “Abrupt onset of the Little Ice Age triggered by volcanism and sustained by sea-ice/ocean feedbacks.” Geophysical Research Letters, 39, L02708, doi:10.1029/2011GL050168.

[xiv]   F. Lehner et al., 2013, “Amplified inception of European Little Ice Age by sea ice–ocean–atmosphere feedbacks.” J. Climate, 26, 7586–7602. https://doi.org/10.1175/JCLI-D-12-00690.1.

[xv]    C. Gao et al., 2008, “Volcanic forcing of climate over the past 1500 years: An improved ice core‐based index for climate models.” Journal of Geophysical Research, 113, D23111, doi: 10.1029/2008JD010239. [See Figure 2, page 5].

[xvi]   Y. Zhong et al., “Centennial-scale climate change from decadally-paced explosive volcanism: a coupled sea ice-ocean mechanism.” Climate Dynamics (2011) 37: 2373. https://doi.org/10.1007/s00382-010-0967-z.
[xvii] J. Slawinska and A. Robock, 2018, “Impact of Volcanic Eruptions on Decadal to Centennial Fluctuations of Arctic Sea Ice Extent during the Last Millennium and on Initiation of the Little Ice Age.” J. Climate, 31, 2145–2167, https://doi.org/10.1175/JCLI-D-16-0498.1.

[xviii]      V. Bucha, “Geomagnetic activity and the North Atlantic Oscillation.” Studia Geophysica et Geodaetica. July 2014, Volume 58, Issue 3, 461–472. https://doi.org/10.1007/s11200-014-0508-z.

[xix]   J. G. Pinto and C. C. Raible, 2012, “Past and recent changes in the North Atlantic oscillation.” WIREs Climate Change, 3: 79-90. doi:10.1002/wcc.150.

[xx]    Jesper Olsen et al., “Variability of the North Atlantic Oscillation over the past 5,200 years.” Nature Geoscience Volume 5, 808–812 (2012). DOI: 10.1038/NGEO1589.

[xxi]   P. Thejll et al., “On correlations between the North Atlantic Oscillation, geopotential heights, and geomagnetic activity.” Geophysical Research Letters, 30 (6), 1347, 2003. doi:10.1029/2002GL016598.

[xxii] J.W. Hurrell et al., 2013, “An Overview of the North Atlantic Oscillation.” In The North Atlantic Oscillation: Climatic Significance and Environmental Impact (eds J. W. Hurrell, Y. Kushnir, G. Ottersen and M. Visbeck). doi:10.1029/134GM01.

[xxiii]      Jesper Olsen et al., “Variability of the North Atlantic Oscillation over the past 5,200 years.” Nature Geoscience Volume 5, 808–812 (2012). DOI: 10.1038/NGEO1589.

[xxiv] A. Mazzarella and N. Scafetta, 2012, “Evidences for a quasi 60-year North Atlantic Oscillation since 1700 and its meaning for global climate change.” Theoretical Applied Climatology 107, 599-609. DOI: 10.1007/s00704-011-0499-4.

[xxv]   T. Bradwell et al., 2006, “The Little Ice Age glacier maximum in Iceland and the North Atlantic Oscillation: evidence from Lambatungnajökull, southeast Iceland.” Boreas, 35: 61-80. doi:10.1111/j.1502-3885.2006.tb01113.x.

[xxvi] Jesper Olsen et al., “Variability of the North Atlantic Oscillation over the past 5,200 years.” Nature Geoscience Volume 5, 808–812 (2012). DOI: 10.1038/NGEO1589.

[xxvii]     M.H. Ambaum and B.J. Hoskins, 2002, “The NAO Troposphere–Stratosphere Connection.” J. Climate, 15, 1969–1978, https://doi.org/10.1175/1520-0442(2002)015<1969:TNTSC>2.0.CO;2.

[xxviii]    V. Bucha, “Geomagnetic activity and the North Atlantic Oscillation.” Studia Geophysica et Geodaetica. July 2014, Volume 58, Issue 3, 461–472. https://doi.org/10.1007/s11200-014-0508-z.

[xxix] P. B. Thejll et al., “On correlations between the North Atlantic Oscillation, geopotential heights, and geomagnetic activity.” Geophysical Research Letters, 30 (6), 1347, 2003. doi:10.1029/2002GL016598.

[xxx]   H. Lu et al., 2008, “Possible solar wind effect on the northern annular mode and northern hemispheric circulation during winter and spring.” Journal of Geophysical Research, 113, D23104, doi: 10.1029/2008JD010848.

[xxxi] V. Bucha, “Geomagnetic activity and the North Atlantic Oscillation.” Studia Geophysica et Geodaetica. July 2014, Volume 58, Issue 3, 461–472. https://doi.org/10.1007/s11200-014-0508-z.

[xxxii]     J.W. Hurrell et al., 2013, “An Overview of the North Atlantic Oscillation.” In The North Atlantic Oscillation: Climatic Significance and Environmental Impact (eds J. W. Hurrell, Y. Kushnir, G. Ottersen and M. Visbeck). doi:10.1029/134GM01.

[xxxiii]    J.W. Hurrell et al., 2013, “An Overview of the North Atlantic Oscillation.” In The North Atlantic Oscillation: Climatic Significance and Environmental Impact (eds J. W. Hurrell, Y. Kushnir, G. Ottersen and M. Visbeck). doi:10.1029/134GM01. [Citing Robock and Mao, 1992; Kodera, 1994; Graf et al., 1994; Kelley et al., 1996.].

[xxxiv]    J. Slawinska and A. Robock, 2018, “Impact of Volcanic Eruptions on Decadal to Centennial Fluctuations of Arctic Sea Ice Extent during the Last Millennium and on Initiation of the Little Ice Age.” J. Climate, 31, 2145–2167, https://doi.org/10.1175/JCLI-D-16-0498.1.

[xxxv]     F. Lehner et al., 2013, “Amplified inception of European Little Ice Age by sea ice–ocean–atmosphere feedbacks.” J. Climate, 26, 7586–7602. https://doi.org/10.1175/JCLI-D-12-00690.1.

[xxxvi]    C. Newhall et al., 2018, “Anticipating future Volcanic Explosivity Index (VEI) 7 eruptions and their chilling impacts.” Geosphere, v. 14, no. 2, p. 1–32, doi:10.1130/GES01513.1.

[xxxvii]   Odd Helge Otterå et al., “External forcing as a metronome for Atlantic multidecadal variability.” Nature Geoscience Volume 3, 688–694 (2010).

[xxxviii] Y. Zhong et al., “Centennial-scale climate change from decadally-paced explosive volcanism: a coupled sea ice-ocean mechanism.” Climate Dynamics (2011) 37: 2373. https://doi.org/10.1007/s00382-010-0967-z.
Climate-forcing volcanic eruptions correlate with solar activity

Climate-forcing volcanic eruptions correlate with solar activity

Figure 5.3. A) Five hundred-year totals of large volcanic eruptions were plotted against 500-year average sunspot numbers occurring since the Holocene Climate Optimum. The two-period moving average trend lines highlight an inverse relationship (i.e., one goes up, the other comes down). The last 2,500 years have seen a declining trend in 500-year sunspot numbers, with the 500-year period ending in 1895 having the lowest 500-year sunspot number average in 7,500 years. B) A scatter plot presents 5.3.A’s data differently, and highlights a statistically significant relationship between long-term average sunspot numbers and climate-forcing large volcanic eruptions.[1]

The above-described relationship markedly diminished when the period of correlation calculation was extended from the last 8,000 years out to the last 11,000 years. The correlation also diminished when the duration of the 500-year average sunspot numbers and the 500-year bin totals of climate-forcing volcanic eruptions were each reduced to 400 and 300 years. If the solar activity-volcanism relationship is real, then a long-term process involving magnetized solar wind is implicated in causing climate-forcing volcanic eruptions, because these sunspot numbers were derived from carbon-14 isotopes found in tree rings (see citation note).[2]

A stronger non-linear relationship than described above was demonstrated using the VOGRIPA Large Magnitude Explosive Volcanic Eruption database data, while utilizing the same methodology detailed in Figures 5.3.A and 5.3.B. This non-linear relationship, if real, would seem to indicate that as the 500-year average sunspot number declines below 17 there is an accelerative increase in climate-forcing large magnitude volcanic eruptions (VEI 4–7), i.e., more bang for your low sunspot number buck. However, caution is merited in interpreting this potential non-linear relationship, given that many volcanic eruptions in the more distant past (i.e., before the last millennium) are not part of the scientific record. This can give the impression of an accelerative increase in volcanism during the Little Ice Age.[3],[4]

The conclusion drawn from this research is that if low sunspot numbers are involved in triggering climate-forcing volcanism, then a long-term process involving magnetized solar wind is implicated.

Click on this page and download a free copy of my book “Revolution: Ice Age Re-Entry,” and read more about this topic in Chapter 5 and answers to the above question.


[1]      Data: (1) Takuro Kobashi et al., 2017, “Volcanic influence on centennial to millennial Holocene Greenland temperature change.” Scientific Reports, 7, 1441. doi: 10.1038/s41598-017-01451-7. Data provided by the National Centers for Environmental Information, NESDIS, NOAA, U.S. Department of Commerce. https://www.ncdc.noaa.gov/paleo-search/study/22057. Data accessed 21/08/2018. (2) S.K. Solanki et al., 2004, “An unusually active Sun during recent decades compared to the previous 11,000 years.” Nature, Volume 431, No. 7012, 1084-1087, 28 October 2004. Data: S.K. Solanki et al., 2005, “11,000 Year Sunspot Number Reconstruction.” IGBP PAGES/World Data Center for Paleoclimatology. Data Contribution Series #2005-015. NOAA/NGDC Paleoclimatology Program, Boulder CO, USA. https://www.ncdc.noaa.gov/paleo-search/study/5780. Downloaded 05/06/2018. Personal Research: Figure A). Using the above-cited data and the methodology cited in Figure 5.1.A of my book (Revolution: Ice Age Re-Entry, https://amzn.to/2PyQsxV), the largest climate-forcing volcanic eruptions (≤5 Watts/meter-squared) were grouped into 500-year bin totals starting in 1895 and extending back 8,000 years. Five hundred-year average sunspot numbers were generated for the corresponding periods. Figure 5.3.A: Both previously derived parameters were plotted against one another and a two-period moving average created to highlight the inverse relationship. Figure B). Both previously derived parameters were plotted using a scatter plot (Microsoft Excel) and a linear trend line fitted. Pearson and Spearman rank correlations were calculated, with both yielding a correlation coefficient r = -0.72, two-tailed P-value 0.002 (N=43 eruptions organized into 16 groups). There were no outliers for either parameter. A goodness of fit using the Shapiro-Wilks test indicated the 500-year sunspot number averages were normally distributed. The 500-year bin totals of volcanic eruptions yielded a P = 0.031 indicating a non-normal distribution, hence the Spearman rank correlation inclusion.

[2]      I.G.M. Usoskin et al., “Solar activity, cosmic rays, and Earth’s temperature: A millennium-scale comparison.” Journal of Geophysical Research, 110, A10102, doi:10.1029/2004JA010946. [Exposé: See page 1. This tells us cosmogenic isotopes (Beryllium-10, Carbon-14) are used as proxies for solar activity, and that their production is caused by galactic cosmic ray flux, which is influenced by the solar system’s (heliospheric) magnetic field and is modulated by solar activity. Comment: Magnetized solar wind modulates the solar system’s magnetic shield (i.e., the heliosphere) and the earth’s magnetic shield (i.e. the magnetosphere), thereby regulating cosmic ray entry into the solar system and the earth system respectively. Cosmic ray entry into the upper atmosphere from space is modulated by solar activity and geomagnetism. Lower solar activity and lower geomagnetism permit more cosmic ray entry into the atmosphere, and conversely. Increased cosmic ray levels are associated with increased low-cloud formation, which is associated with planetary cooling, and conversely. The cosmic ray and low-cloud cooling effect are concentrated into the polar regions. Cosmogenic isotopes (Carbon-14, Beryllium-10) are generated by cosmic rays in the atmosphere, with more cosmic rays generating more cosmogenic isotopes, and conversely. Cosmogenic isotopes are then embedded in earth repositories (i.e., tree rings, ice cores) and therefore indirectly tell us about solar activity and the resulting magnetized solar wind that contacts the earth’s magnetosphere. By utilizing cosmogenic isotopes to assess relationships between the sun and earth systems (i.e., climate, volcanism) we know that the solar activity that is being assessed is magnetism based, and not electromagnetism (i.e. not solar irradiance).].

[3]      Data: (1) Helen Sian Crosweller et al., “Global database on large magnitude explosive volcanic eruptions (LaMEVE).” Journal of Applied Volcanology Society and Volcanoes 20121:4. https://doi.org/10.1186/2191-5040-1-4. Volcano Global Risk Identification and Analysis Project database (VOGRIPA), British Geological Survey. Data Access: http://www.bgs.ac.uk/vogripa/. Data downloaded 07/05/2018. (2) S.K. Solanki et al., 2004, “An unusually active Sun during recent decades compared to the previous 11,000 years.” Nature, Volume 431, No. 7012, 1084-1087, 28 October 2004. Data: S.K. Solanki et al., 2005, “11,000 Year Sunspot Number Reconstruction.” IGBP PAGES/World Data Center for Paleoclimatology. Data Contribution Series #2005-015. NOAA/NGDC Paleoclimatology Program, Boulder CO, USA. https://www.ncdc.noaa.gov/paleo-search/study/5780. Downloaded 05/06/2018. Personal Research: Utilizing VOGRIPA’s LaMEVE VEI 4-7 eruption events, these were grouped into 500-year bins from 1899 and back over the prior 5,000 years. The above cited Solanki, S.K., et al. was used to calculate 500-year average sunspot numbers. Using Microsoft Excel scatter plots were created, and various trend lines were fitted to the data. The power trend best optimized the R-squared value; (1) Power 0.803 versus (2) Exponential 0.748, (3) Logarithmic 0.713, and (4) Linear 0.639. The significant non-linear expansion in the number of large magnitude volcanic eruptions observed during the period 1400 to 1899 CE (i.e., the Little Ice Age) corresponded with the lowest 500-year average sunspot number in 7,000 years (mean of 15 sunspots). Cautionary Note: See the following citation (S.K. Brown et al., 2014) for an analysis-critique of the VOGRIPA database’s recognized underreporting bias. This inadvertent underreporting of eruptions theoretically skews the data, so a higher incidence of volcanic eruptions or a growing frequency is more “apparent” over the last millennium. The VOGRIPA database represents the best of its kind and compiles numerous other databases. This LaMEVE database skewing gives the impression of an acceleration effect in the frequency of VEI 4-7 eruptions over the last 1,000 years compared with the prior 10,000 years and 2.6 million year period. This theoretically confounds the interpretation of the result, meriting caution with its interpretation. However, the VOGRIPA data derived result should not be fully dismissed because it highlights a similar trend to the Kobashi et al data (previously cited).].

[4]      S.K. Brown et al., “Characterization of the Quaternary eruption record: analysis of the Large Magnitude Explosive Volcanic Eruptions (LaMEVE) database.” J Appl. Volcanology. (2014) 3: 5. https://doi.org/10.1186/2191-5040-3-5.

Pandemic influenza outbreaks bias sunspot number peaks and troughs

Pandemic influenza outbreaks bias sunspot number peaks and troughs

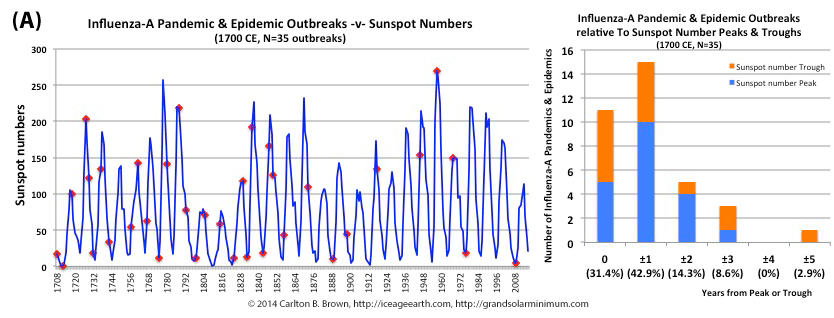
Figure A. Historical pandemic and epidemic influenza-A outbreak data was extracted from six scientific publications reviewing the history of influenza, providing a general consensus on pandemic flu outbreaks (and major regional epidemics) back to 1500. These were plotted against observed sunspot numbers. See the citation for all data.[i] Seventy-four percent of influenza pandemics and epidemics (26/35 events) since 1700 CE occurred at or within one year of the peak or trough in sunspot numbers, increasing to 89 percent (31/35) within two years. The average sunspot number for pandemics occurring at sunspot number troughs was 12 (18 for pandemics occurring within one year of a sunspot number trough). The 2018 sunspot number was 22.

Based on sunspot numbers, we are approaching a high-risk period for pandemic flu. This increased risk is given more gravity, considering half of all pandemics since 1600 CE occurred in the trough of grand solar minima. The sun has already entered a grand solar minimum.

The influenza-A viruses we really have to worry about are highly pathogenic avian influenza-A H7N9 and H5N1. Since 1997 other animal influenza-A viruses have also killed humans, and these continue to pose risks.[ii],[iii],[iv],[v]

H7N9 is killing between 25 and 40 percent of humans infected.[vi],[vii] Animal-to-human infections emerged in China in 2013, and grew year by year to a total of 1,600 animal-to-human infections reported by 2017.[viii],[ix],[x] Specific viral mutations that facilitate human infection have since emerged,[xi] meaning human-to-human transmission is next. The situation is similar with the H5N1 virus, which has killed more than 50 percent of humans infected.[xii],[xiii],[xiv],[xv]

Pandemics have historically spread rapidly throughout the world, and up to half the human population is typically infected.[xvi],[xvii],[xviii],[xix] Pandemic flu viruses that kill a high percentage of their victims do so because they cause a high incidence of severe pneumonia and multi-organ failure. This requires intensive hospital care, with the availability of hospital intensive care a potential bottleneck.

The 1918–1919 pandemic flu virus caused acute swelling of and bleeding from the lungs, and people who were infected typically suffocated within one to two days. The second wave of the pandemic was responsible for the most deaths, due to an unusually severe hemorrhagic pneumonia. H5N1 victims today experience similar pathologies to those of the 1918–1919 pandemic, with acute respiratory distress syndrome occurring in 50 to 75 percent of infections.[xx],[xxi]

Likewise, since 2013 more than 90 percent of humans dying from H7N9 infection suffered from pneumonia, respiratory failure, or acute respiratory distress syndrome. Most of the infected people who were hospitalized were admitted to an intensive care unit. With ongoing viral mutations of H7N9 known to improve human viral transmission,[xxii] this is a very worrying virus indeed.

Click on this page and download a free copy of my book “Revolution: Ice Age Re-Entry,” and read more about this topic in Chapter 14.


[i]   Data: (1) Yearly mean total sunspot number (1700 – 2017). Sunspot data from the World Data Center SILSO, Royal Observatory of Belgium, Brussels. http://sidc.be/silso/datafiles#total. Downloaded 05/05/2018. (2) Influenza pandemic and epidemic publications: (a) B. Lina, 2008, History of Influenza Pandemics. In: Raoult D., Drancourt M. (eds) Paleomicrobiology. Springer, Berlin, Heidelberg. https://doi.org/10.1007/978-3-540-75855-6_12. (b) E. Tognotti, 2009, Influenza pandemics: a historical retrospect. Journal of Infection in Developing Countries, 3:331-334. doi: https://doi.org/10.3855/jidc.239. (c) C. Potter, 2001, A history of influenza. Journal of Applied Microbiology, 91: 572-579. doi:10.1046/j.1365-2672.2001.01492.x. (d) J.K. Taubenberger and D.M. Morens, 1918 Influenza: the Mother of All Pandemics. Emerging Infectious Diseases. 2006;12(1):15-22. doi:10.3201/eid1201.050979. (e) Edwin D. Kilbourne, Influenza. Chapter 1; History of Influenza. Springer Science & Business Media, 6/12/2012 – Medical. ISBN 978-1-4684-5239-6. (f) Svenn-Erik Mamelund, Influenza, Historical. December 2008. International Encyclopedia of Public Health, First Edition (2008), vol. 3, pp. 597-609. DOI: 10.1016/B978-012373960-5.00372-5..

[ii] J.K. Taubenberger and D.M. Morens, “Pandemic influenza – including a risk assessment of H5N1.” Revue scientifique et technique (International Office of Epizootics). 2009;28(1):187-202.

[iii] M. Gilbert et al., “Climate change and avian influenza.” Revue scientifique et technique (International Office of Epizootics). 2008;27(2):459-466.

[iv] Mark A. Miller et al., “The Signature Features of Influenza Pandemics —Implications for Policy.” New England Journal of Medicine2009; 360:2595-2598. DOI: 10.1056/NEJMp0903906.

[v] Paul Gillard et al., “Long-term booster schedules with AS03Aadjuvanted heterologous H5N1 vaccines induces rapid and broad immune responses in Asian adults.” BMC Infectious Diseases201414:142. https://doi.org/10.1186/1471-2334-14-142.

[vi] Hai-Nv Gao et al., “Clinical Findings in 111 Cases of Influenza A (H7N9) Virus Infection.” New England Journal of Medicine2013; 368:2277-2285. DOI: 10.1056/NEJMoa1305584.

[vii] Qi Tang et al., “China is closely monitoring an increase in infection with avian influenza A (H7N9) virus.” BioScience Trends. 2017; 11(1):122-124. DOI: 10.5582/bst.2017.01041.

[viii] Yamayoshi S et al., “Enhanced Replication of Highly Pathogenic Influenza A(H7N9) Virus in Humans.” Emerging Infectious Diseases Journal 2018;24(4):746-750. https://dx.doi.org/10.3201/eid2404.171509.

[ix] European Centre for Disease Prevention and Control. “Human infection with avian influenza A(H7N9) virus–fifth update.” 27 February 2017. Stockholm: ECDC; 2017.

[x] Artois J et al., “Changing Geographic Patterns and Risk Factors for Avian Influenza A(H7N9) Infections in Humans, China.” Emerging Infectious Diseases Journal 2018;24(1):87-94. https://dx.doi.org/10.3201/eid2401.171393.

[xi] N. Xiang et al., “Assessing Change in Avian Influenza A(H7N9) Virus Infections During the Fourth Epidemic — China.” September 2015–August 2016. MMWR Morb Mortal Wkly Rep 2016;65:1390–1394. DOI: http://dx.doi.org/10.15585/mmwr.mm6549a2.

[xii] U.S. Department of Health and Human Services. Pandemic Influenza Plan 2017 Update. https://www.cdc.gov/flu/pandemic-resources/pdf/pan-flu-report-2017v2.pdf.

[xiii] Centers for Disease Control and Prevention. “Highly Pathogenic Asian Avian Influenza A (H5N1) in People.” https://www.cdc.gov/flu/avianflu/h5n1-people.htm.

[xiv] Kumnuan Ungchusak et al., “Probable Person-to-Person Transmission of Avian Influenza A (H5N1). 2005.” New England Journal of Medicine2005; 352:333-340. DOI: 10.1056/NEJMoa044021.

[xv] L.O. Durand et al., “Timing of Influenza A(H5N1) in Poultry and Humans and Seasonal Influenza Activity Worldwide, 2004–2013.” Emerging Infectious Diseases Journal 2015;21(2):202-208. https://dx.doi.org/10.3201/eid2102.140877.

[xvi] B. Lina, 2008, “History of Influenza Pandemics.” In: Raoult D., Drancourt M. (eds) Paleomicrobiology. Springer, Berlin, Heidelberg. https://doi.org/10.1007/978-3-540-75855-6_12.

[xvii] E. Tognotti, “Influenza pandemics: a historical retrospect.” The Journal of Infection in Developing Countries 2009, 3: 331-334. DOI: https://doi.org/10.3855/jidc.239.

[xviii] C. Potter, 2001, “A history of influenza.” Journal of Applied Microbiology, 91: 572-579. doi:10.1046/j.1365-2672.2001.01492.x.

[xix] J.K. Taubenberger and D.M. Morens, “1918 Influenza: the Mother of All Pandemics.” Emerging Infectious Diseases. 2006;12(1):15-22. doi:10.3201/eid1201.050979.

[xx] Eugenia Tognotti, “Emerging Problems in Infectious Diseases Influenza pandemics: a historical retrospect.” The Journal of Infection in Developing Countries2009; 3(5):331-334.

[xxi] Yu-Chia Hsieh et al., “Influenza Pandemics: Past, Present and Future.” J. Formos Med Assoc. 2006 Jan;105(1):1-6. DOI:10.1016/S0929-6646(09)60102-9.

[xxii] Xiang N et al., “Assessing Change in Avian Influenza A(H7N9) Virus Infections During the Fourth Epidemic — China.” September 2015–August 2016. MMWR Morb Mortal Wkly Rep 2016;65:1390–1394. DOI: http://dx.doi.org/10.15585/mmwr.mm6549a2.

Pin It on Pinterest