This grand solar minimum portends pandemic influenza outbreaks
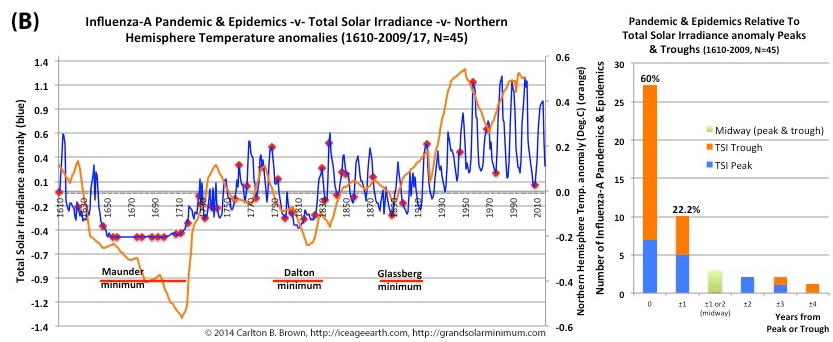
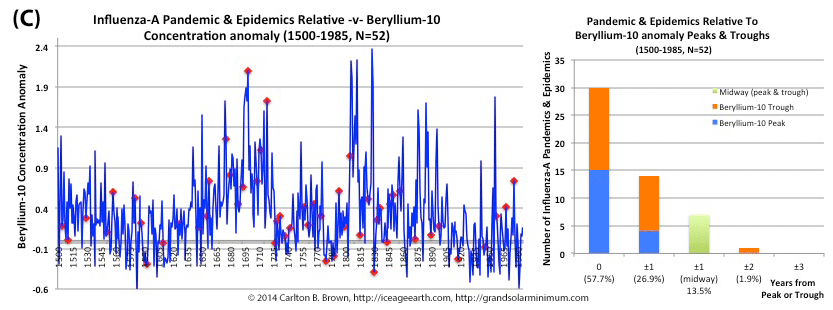
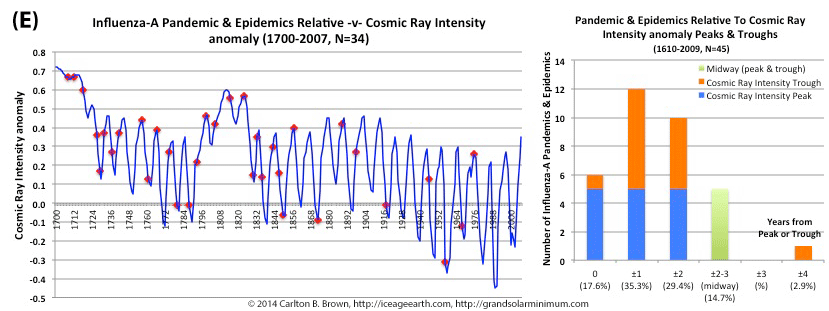
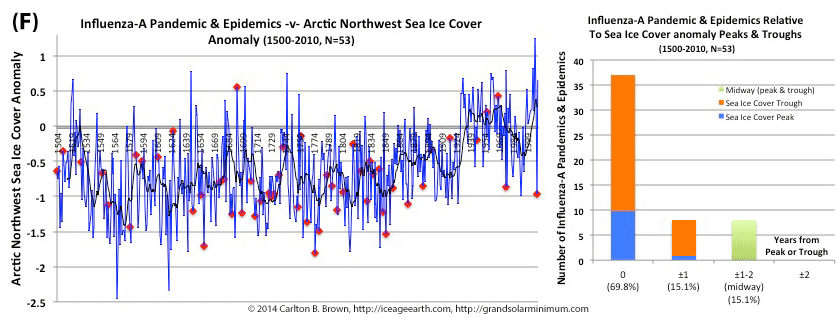
Figure B). Historical pandemic and epidemic influenza-A outbreak data was extracted from six scientific publications reviewing the history of influenza, providing a general consensus on pandemic flu outbreaks (and major regional epidemics) back to 1500. These were plotted against the total solar irradiance and Northern Hemisphere temperature data reconstructions. See the citation for all the data.[i] Between 1610 and 2000, eighty-two percent of influenza pandemics and epidemics (37/45) occurred at or within one year of a peak or trough in the total solar irradiance anomaly. At the same time, sixty-four percent (29/45) of influenza pandemics and epidemics occurred during a negative Northern Hemisphere temperature anomaly.
Half of outbreaks (22/45) between 1600 and 2000 CE occurred when both the Northern Hemisphere temperature and total solar irradiance anomaly were negative, which corresponded with the trough of grand solar minimum periods (during the Little Ice Age). Negative anomalies resulted when the temperature or irradiance value was less than the 1610-2000 average for that parameter.
The obvious conclusion is that grand solar minimum periods associated with a colder climate pose increased risks for pandemic flu outbreaks. The sun is plummeting into the depths of this grand solar minimum and in 2016 the Northern Hemisphere temperatures started to decline.[ii]
We should be VERY WORRIED that governments, the vaccine industry, and WHO will not be able to immunize the world before the peak of a pandemic, or supply sufficient vaccine in an equitable manner. We have the vaccine technology to solve this problem but this has not been implemented since 2009’s swine flu pandemic. Read Chapter 14 to find out why we are left fully vulnerable to a bad pandemic outbreak.
Click on this page and download a free copy of my book “Revolution: Ice Age Re-Entry,” and read more about this topic in Chapter 14.
[i] Data: (1) Figure 14.1.B: T. Kobashi et al., 2013. Causes of Greenland temperature variability over the past 4000 year: implications for northern hemispheric temperature changes. Climate of the Past, 9(5), 2299-2317. doi: 10.5194/cp-9-2299-2013. National Centers for Environmental Information, NESDIS, NOAA, U.S. Department of Commerce. Northern Hemisphere 4000 Year Temperature Reconstructions. https://www.ncdc.noaa.gov/paleo/study/15535. Downloaded 05/05/2018. (2) The total solar irradiance (TSI) reconstruction was based on NRLTSI2 (Coddington et al., BAMS, 2015 doi: 10.1175/BAMS-D-14-00265.1). http://spot.colorado.edu/~koppg/TSI/TIM_TSI_Reconstruction.txt. (3) Influenza pandemic and epidemic publications: (a) B. Lina, 2008, History of Influenza Pandemics. In: Raoult D., Drancourt M. (eds) Paleomicrobiology. Springer, Berlin, Heidelberg. https://doi.org/10.1007/978-3-540-75855-6_12. (b) E. Tognotti, 2009, Influenza pandemics: a historical retrospect. Journal of Infection in Developing Countries, 3:331-334. doi: https://doi.org/10.3855/jidc.239. (c) C. Potter, 2001, A history of influenza. Journal of Applied Microbiology, 91: 572-579. doi:10.1046/j.1365-2672.2001.01492.x. (d) J.K. Taubenberger and D.M. Morens, 1918 Influenza: the Mother of All Pandemics. Emerging Infectious Diseases. 2006;12(1):15-22. doi:10.3201/eid1201.050979. (e) Edwin D. Kilbourne, Influenza. Chapter 1; History of Influenza. Springer Science & Business Media, 6/12/2012 – Medical. ISBN 978-1-4684-5239-6. (f) Svenn-Erik Mamelund, Influenza, Historical. December 2008. International Encyclopedia of Public Health, First Edition (2008), vol. 3, pp. 597-609. DOI: 10.1016/B978-012373960-5.00372-5.
[ii] Global mean surface temperature data, commonly referred to as HadCRUT4. https://www.metoffice.gov.uk/hadobs/hadcrut4/data/current/download.html. [Exposé: Look at the bottom left hand or first column for the current year-to-date temperature. Subtract that from the 2016 total to see the magnitude of the fall. Global Data: https://bit.ly/2nCgctz. Northern Hemisphere Data: https://bit.ly/2MRt75G, Southern Hemisphere Data: https://bit.ly/2nBfYTA. Tropics Data: https://bit.ly/2nFXJMM. [last downloaded 25/07/2018].


Recent Comments